Department of Conservation and Recreation
Conserve. Protect. Enjoy.
Department of Conservation and Recreation


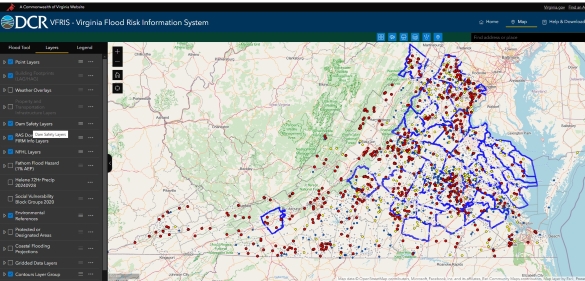
The Virginia Flood Risk Information System (VFRIS) is a quick and simple way to help communities, real estate agents and property owners to determine their flood risk.
VFRIS has undergone a refresh for 2025 and now integrates data from dozens of trusted sources, offering a wealth of information that can be layered on top of a location’s flood risk.
After inputting your address, the default view will alert you of your flood risk, specifically if you’re in a Special Flood Hazard Area (SFHA). Click “View More Details” to display the “Flood Tool” panel, allowing you to see information including the latest flood insurance study and Community Rating System (CRS) Class based on the address entered.
Read on for more ways to use VFRIS:
VFRIS integrates Dam Safety data from DCR’s Open Data Hub. Selecting “Dam Safety Layers” on the Layers pane displays the following data points:
For more information on data included in this layer, visit DCR’s Open Data Hub and the Virginia Dam Safety Inventory System (DSIS).
The Protected Lands layer represents the most up to date version of protected lands within the Chesapeake Bay Watershed with data from the Chesapeake Bay Program. Protected lands are defined as “lands that are permanently protected from development, whether by purchase, donation, a perpetual conservation or open space easement, or fee ownership for their cultural, historical, ecological or agricultural value.” Selecting a colored polygon in this layer will display the ownership type of the protected area (local, state, federal) along with the property name.
The Coastal Barrier Resources System data layers can be used to help property owners, local, state and federal stakeholders, and the public determine whether properties or project sites may be affected by Coastal Barrier Resources Act. Maps are maintained by the U.S. Fish and Wildlife Service.
The Critical Habitat layer identifies areas that the U.S. Fish and Wildlife Service designates as “critical habitat” for endangered or threatened species under the Endangered Species Act. Critical habitat is a specific geographic area that contains features essential for the conservation of a threatened or endangered species and may require special management and protection. It also may include an area that is not currently occupied by the species but that will be needed for its recovery.
Anywhere it can rain, it can flood. More than 40% of National Flood Insurance Program (NFIP) claims come from outside the highest-risk areas included in FEMA’s regulatory special flood hazard area. FEMA’s flood hazard data has limitations – including in coverage and forecasted future flood hazard conditions. DCR provides non-regulatory flood hazard data about additional locations with the potential for flooding. Where multiple flood hazard data sources exist, users are encouraged to utilize the best available data for their use case.
The Fathom Flood Hazard (1% AEP) layer displays a non-regulatory 1% annual chance floodplain (also known as the 100-year floodplain) from the three major sources of flooding: coastal, riverine, and rainfall-driven. The data was developed by Fathom, a third-party flood hazard data provider. DCR is leveraging this data to fill gaps in outdated and incomplete FEMA flood hazard data for the Virginia Flood Protection Master Plan. The statewide dataset includes areas vulnerable to rainfall-driven flooding not typically mapped by FEMA. However, it is important to note that the data is not verified against local conditions through field surveys and therefore may include localized inaccuracies.
The Coastal Flooding Projections layers display non-regulatory models for forecasted flooding in future conditions. These layers are provided to help users understand how conditions of flooding may change due to sea level rise. The Sea Level Rise (NOAA 2017) layer displays forecasted boundaries of coastal waters in 2100 as modeled by the National Oceanic and Atmospheric Administration (NOAA)’s 2017 intermediate-high sea level rise curve. The five Coastal Flooding (DCR CRMP) layers display forecasted coastal flooding extents developed for the Virginia Coastal Resilience Master Plan. These layers show the potential extents of flooding in different flood events, ranging from tidal inundation to the 0.2% annual chance flood. Each layer represents a different time horizon. The Coastal Flooding layers and additional information about their creation are available in the Coastal Resilience Web Explorer (CRWE).
The Coastal Resilience Master Plan is currently being updated. Phase II of the plan will be available soon. Following the update plan’s release, new flood hazard forecast layers will be made available via VFRIS and the CRWE.
Categories
Dam Safety | Dam Safety and Floodplains | Flood Resilience | Floodplain Management